How to find value bets with Datafoot odds profiling
Why are some odds profitable in the long run while others make you lose money? The answer comes down to one word: value. In sports betting, a value bet is a situation where the real probability of an event is higher than the probability estimated by the bookmaker. To identify these opportunities, Datafoot offers a powerful feature: odds profiling.
What is odds profiling?
Odds profiling consists of analyzing historical matches that had odds similar to the match you are studying. Instead of focusing only on the teams, this approach helps you study how similar odds have behaved over time. The goal is to identify reliable and repeatable statistical trends.
How to use odds profiling on Datafoot
To use this tool efficiently, you only need to follow a few simple steps. Start by opening the match sheet from the schedule, then go to the odds profiling tab. You can then adjust the odds gap, usually around 13%, to find a good balance between accuracy and the volume of data analyzed.
The key signal: the green square
Odds profiling is based on a simple and powerful indicator. Datafoot multiplies the historical probability of an event by the current odds offered by the bookmaker. When this result is greater than 1, value is detected and a green square appears. This means the bet is statistically profitable in the long run.
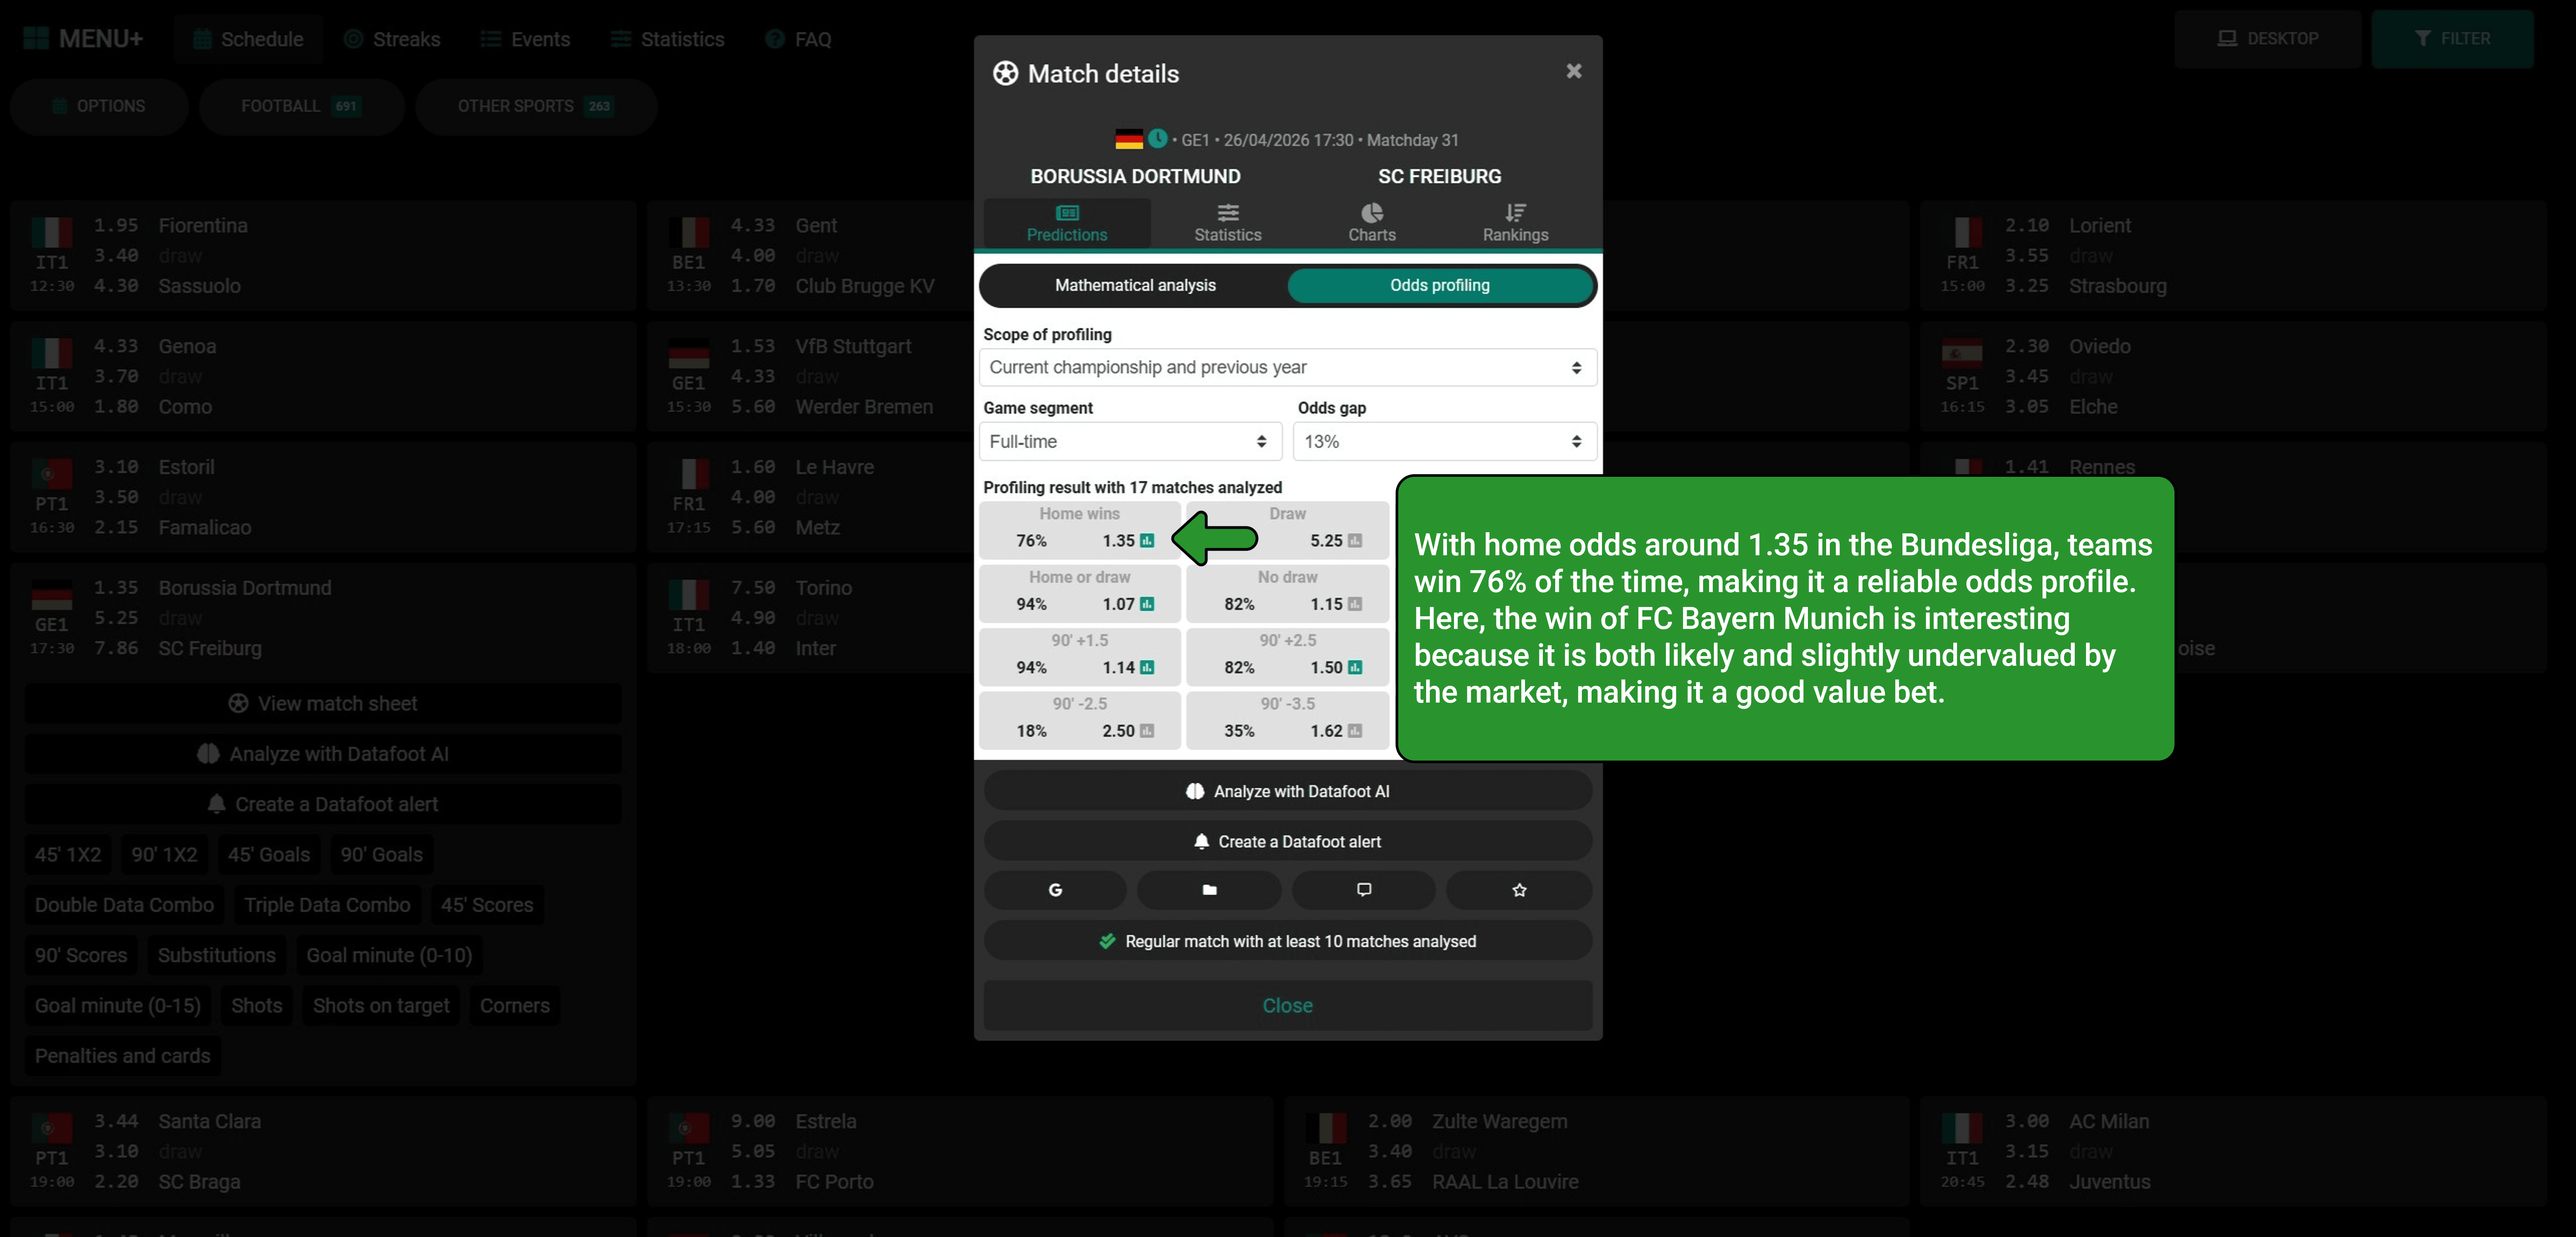
Concrete example: Dortmund vs Freiburg
On a match such as Dortmund against Freiburg, the home win rate can reach 76% for odds close to 1.35. The calculation gives a positive value, but a weaker one. This type of situation can still be interesting, but it requires stricter selection within a global strategy.
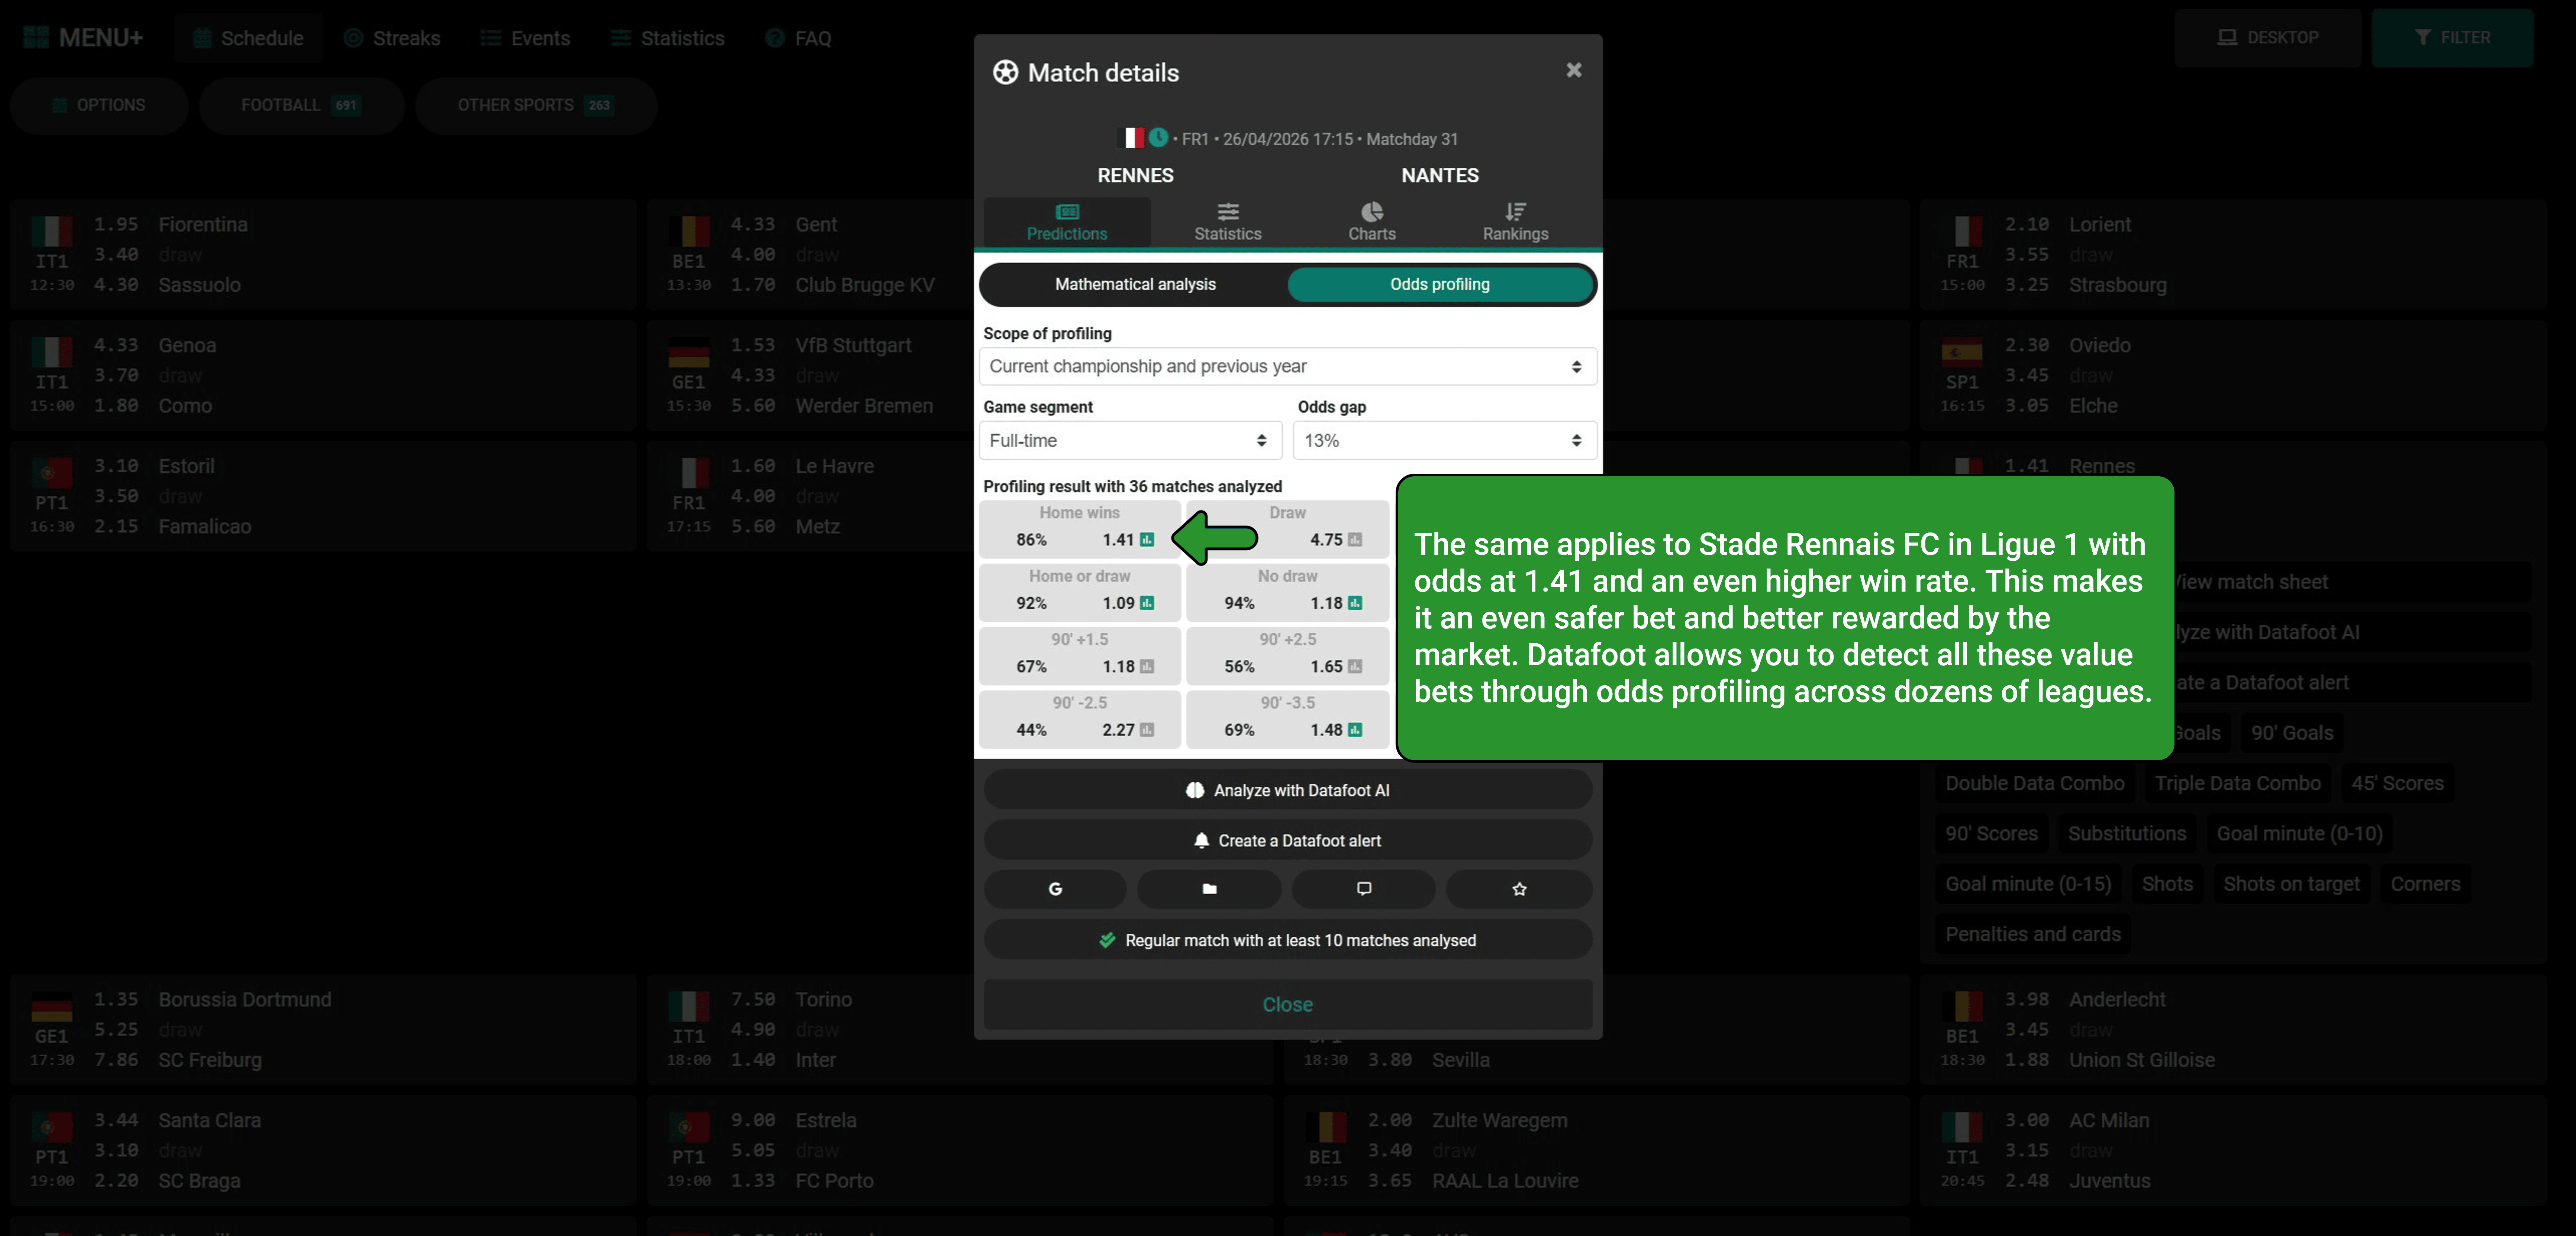
Concrete example: Rennes vs Nantes
On another match such as Rennes against Nantes, odds profiling can show a home win rate of 86% for odds around 1.41. By applying the formula, the result is clearly greater than 1, which confirms strong value. This type of situation usually reflects a very solid favorite with a clear imbalance between the two teams.
Go further with advanced filters
Odds profiling is not limited to the final match result. You can analyze different game segments such as half-time or full-time. You can also adjust the analysis scope by focusing on the entire championship or only on the recent matches of the teams involved. Finally, several betting markets are available, such as 1X2, over/under or BTTS.
Mistakes to avoid
Even with a powerful tool, some mistakes remain common. Relying only on team form, ignoring the real value of the odds or analyzing a sample that is too small can lead to poor decisions. Odds profiling helps reduce these biases by relying on objective data.
A simple strategy example
An effective approach is to target favorites with odds between 1.40 and 1.60 and check that their win rate is above 70%. By selecting only situations with positive value, you can build a consistent and data-driven strategy.
Important: understanding Datafoot odds
The odds displayed on Datafoot are often based on averages from international bookmakers. They can be slightly higher than the odds offered by French bookmakers. This helps improve value bet detection and gives a broader view of the market.
Conclusion
Odds profiling helps you move from an intuitive approach to a data-based approach. By analyzing historical odds trends and identifying value situations, you improve the quality of your betting decisions.It is an essential tool for anyone who wants to build a rigorous and sustainable sports betting strategy.
strategy